
#LookDeeper: CaseFile – graphically illustrate the context of the investigation
This is the first post of a new blog post series. In the next weeks and months I will post the posts under the hashtag #LookDeeper on “Tools and Resources for Internet Investigations and OSINT Research”. This article is about a software I often use in investigations – Maltego CaseFile.
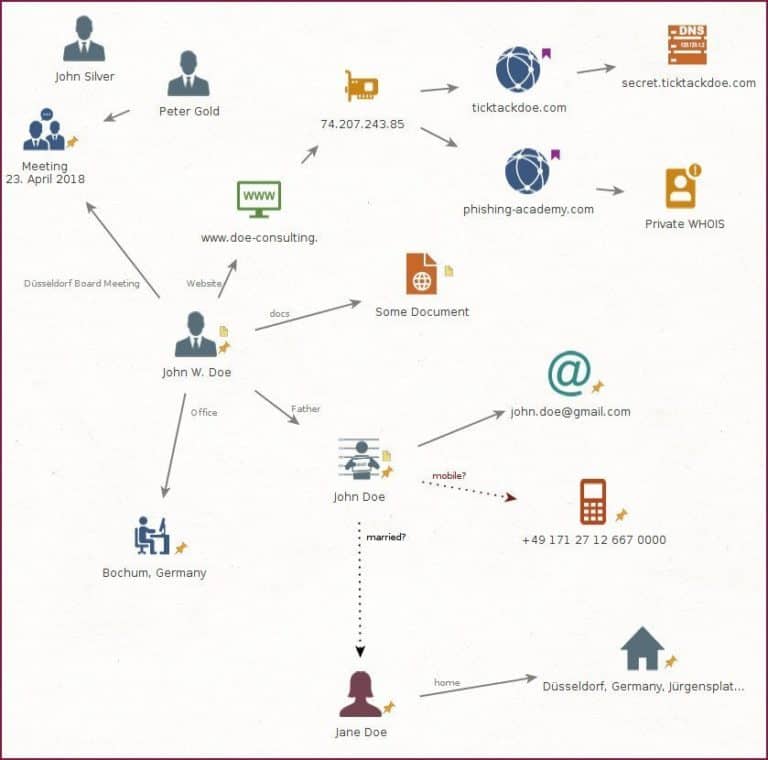
A visualization of the essential information of an investigation case is included in each of our reports. In addition to the overview, e.g. personal profiles or the network of a company are displayed graphically.
Long reports are rarely read completely, so a chart should be included in the summary at the beginning of the report.
A graphic then tells the story of the case without complex explanations. Which tool can I use to create such meaningful presentations? In this post I present the free tool CaseFile from Paterva as a possible solution. Quasi the younger brother of Maltego 🙂
Description of the Tool
CaseFile works similar to Maltego, but without transformations. See this overview:
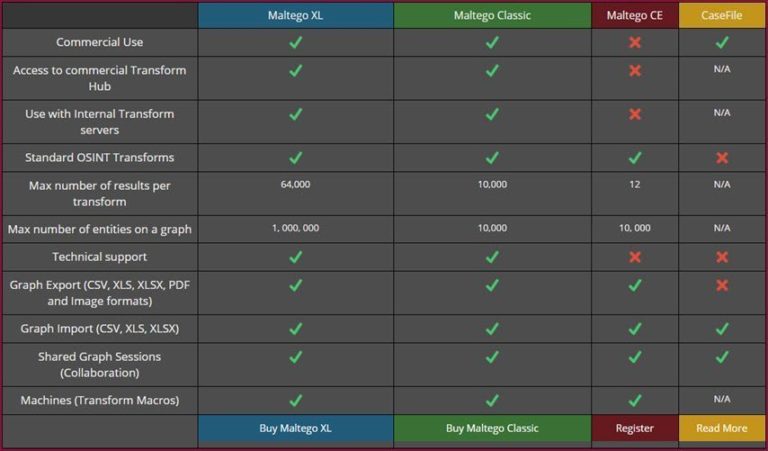
The software is available for three operating systems. Windows, MAC, Linux.
The installation is simple and does not require any special knowledge. The program requires Java.
Unfortunately, CaseFile cannot be installed at the same time as Maltego, but can be used in parallel as a workaround via a virtual machine. I recommend using Buscador as a virtual machine. Casefile is easy to install on this Ubuntu environment.
What is CaseFile about?
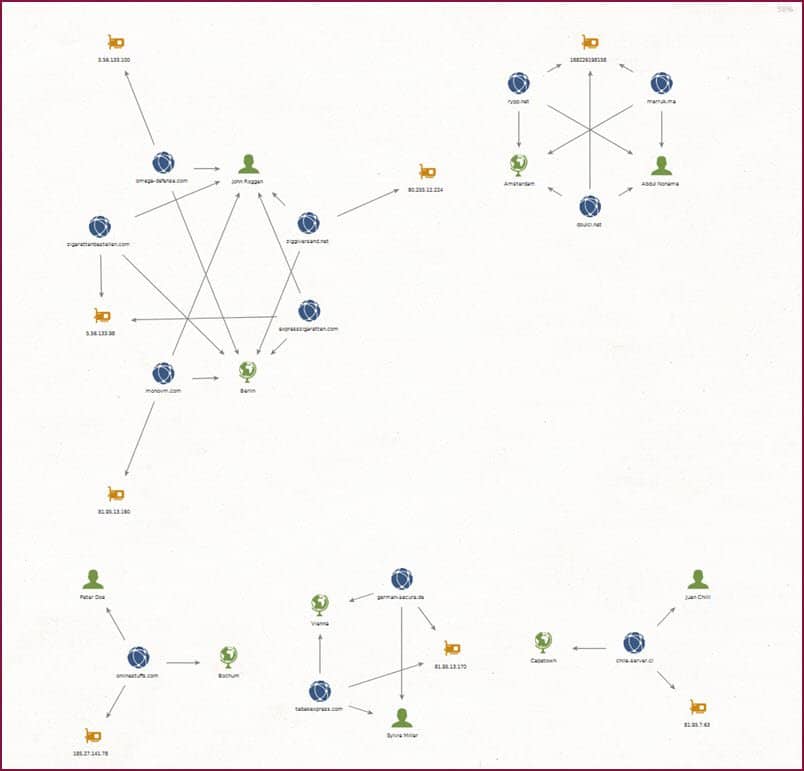
With CaseFile, the relationships between entities and other information can be displayed clearly and quickly in a graph (chart).
For example, I can insert attachments by dragging and dropping them onto the graph or the selected entity. Attachments can be for example photos, documents or PDF files.
These inserted attachments are then available in the graph.
Entity links are easy to perform. Thus, directed relationships can be displayed or icons can be connected visually. Links can be displayed in different colors, strengths and styles. The inscription can be entered freely.
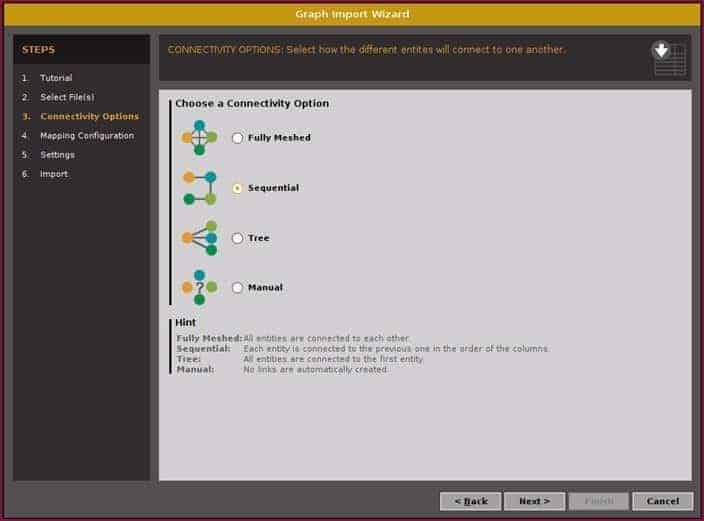
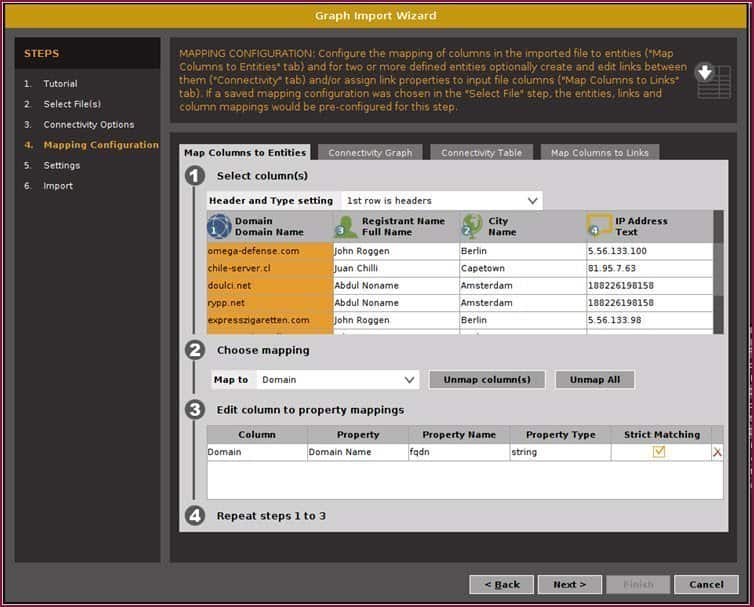
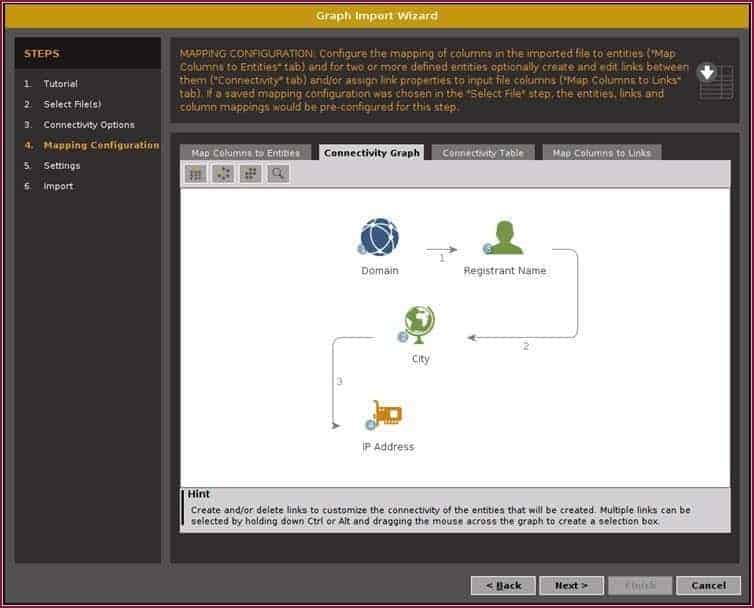
Another feature is the import of structured data as CSV/XLS file.
The intelligent import assistant guides the user step-by-step through the process. A comprehensive description is also available.
Furthermore, I can insert information from the browser into the graph via “Drag and Drop” or “Copy & Paste”. This also works with other sources, like the cache or the clipboard.
For example, a pasted name will be recognized and displayed as a person in the chart. This also works with mail addresses, domains, URL’s, phone numbers and other entities.
I can also combine finished graphs. Here I am asked if I want to merge identical entities and get a hint to possible unknown connections.
I can display two sections of a discovery in different graphs and then combine them. Then I immediately visualized the connections I didn’t know before. (Merging / merging of the entities existing in both charts)
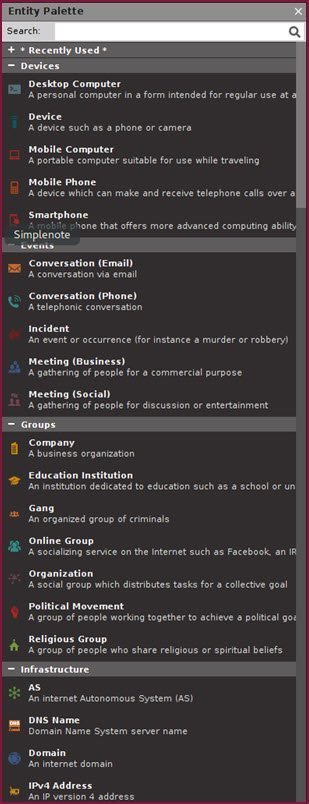
There are a number of entities that are not available in the standard version of Paterva’s Maltego. The entities as a whole are divided into the adjacent categories.
More Features of Casefile
In addition, I can download icons from other sources or create them myself.
https://github.com/deadbits/Analyst-CaseFile
http://cmlh.pbworks.com/w/page/59648366/Entities
I can mark groups of entities with colored bookmarks and then select them later with a single click.
CaseFile can be used very well as a free viewer for all commercial Maltego files! The recipient of a Maltego graph can then work interactively with the data. This is much better than sending a PDF file.
The Tool in Use
An example for the use: CaseFile is open during the search in the Web. I drag and drop relevant information onto the graph. I create suitable links between the entities and add documents. So I always have an overview and the current status of my research. I can send this visual summary to the customer as a PDF file, which can be read easily and quickly. If CaseFile is installed on the client’s computer, the original file can of course also be shared.
Thanks to the different views and layouts, CaseFile is also suitable for a visual analysis of structured data.
Pros and cons
The software is free of charge, even for commercial use. The idea behind it is the offline analysis of structured data. This makes it quick and easy to display correlations. The tool is the perfect solution for exactly this idea.
There are still some ideas for the optimization in the area of the representation. For example the possibility to insert a legend explaining the used entities and links. The information panel could contain information about the creator, date and case information.
I don’t have some graphical possibilities, for example to draw and label a frame around a group of entities. I would also like to mark selected icons more clearly, e.g. with a colored circle like IBM i2 Analyst’s Notebook (ANB).
Differences CaseFile to IBM i2 Analyst’s Notebook (ANB)
One of the most important differences between the software solutions is the price. Free vs. 8.500 EUR is already an argument. But there is a reason for that. ANB has an enormous range of functions. I have been using ANB for many years, but we almost always use it in conjunction with the IBM i2 iBase database in our investigations. With the large amounts of data in the corma Intelligence solutions, the tool shows its strengths.
But if I only use it to create a chart, then I see the following advantages of Analyst’s Notebook compared to CaseFile:
Different analysis views
- For example, timeline and statistical presentation
- Thematic lines
Advanced analysis functions, such as
- Social Network Analysis (SNA)
- Histograms
- Activity view
Numerous graphical extensions, such as
- Text blocks
- Different representations of the entities, e.g. as an event frame or icon
- Links for links (helpful to create a clear chart)
Publications are easy to create
- e.g. as PDF in different sizes
- Legends can be inserted quickly
- A chart reader is available free of charge
The different layouts of Analyst’s Notebook are quite nice, but in practice quite useless. So the chart almost always gets so big or so small that contents are hard to read. Here manual rework is required and the time expenditure should not be underestimated.
ANB cannot do anything with “Copy & Paste” of information in the chart. Analyst’s Notebook does not recognize a mail entity from an e-mail in the clipboard.
From my point of view the investment in Analyst’s Notebook is not worthwhile if I only want to create simple charts for research and cases.
Conclusion
CaseFile belongs to the toolbox of every investigator and analyst.